PVC Plastic Slippers
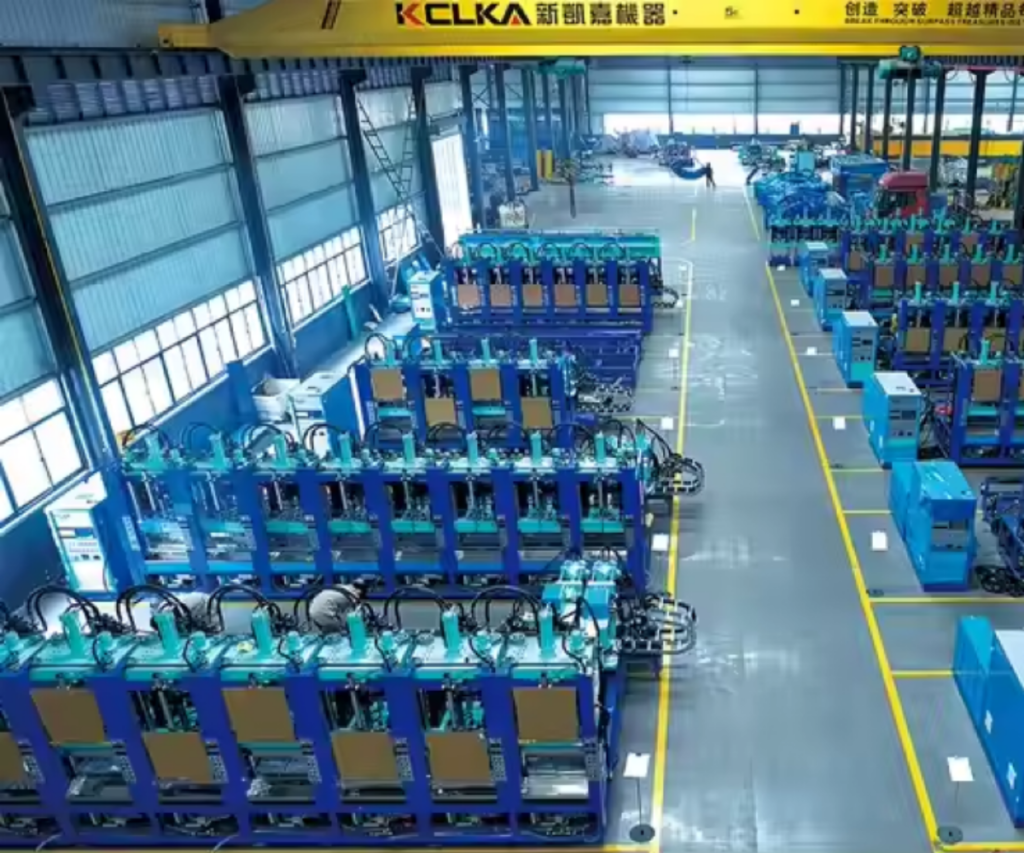
We are a Chinese company mainly for home and outdoor slippers. With an extensive factory resources, it is easy for us to offerbelow service
- low MOQ - even 200 pieces
- short L/T- 7 days
- free design - logo & pattern printing
Why Choose us?
Low MOQ
Small MOQ is available and you can purchase different types in one batch

Fast Delivery
We’re so confident in our slippers that we offer a 7-15 day lead time on all orders.

Competitive Price
We always provide high-quality slippers at an affordable price.
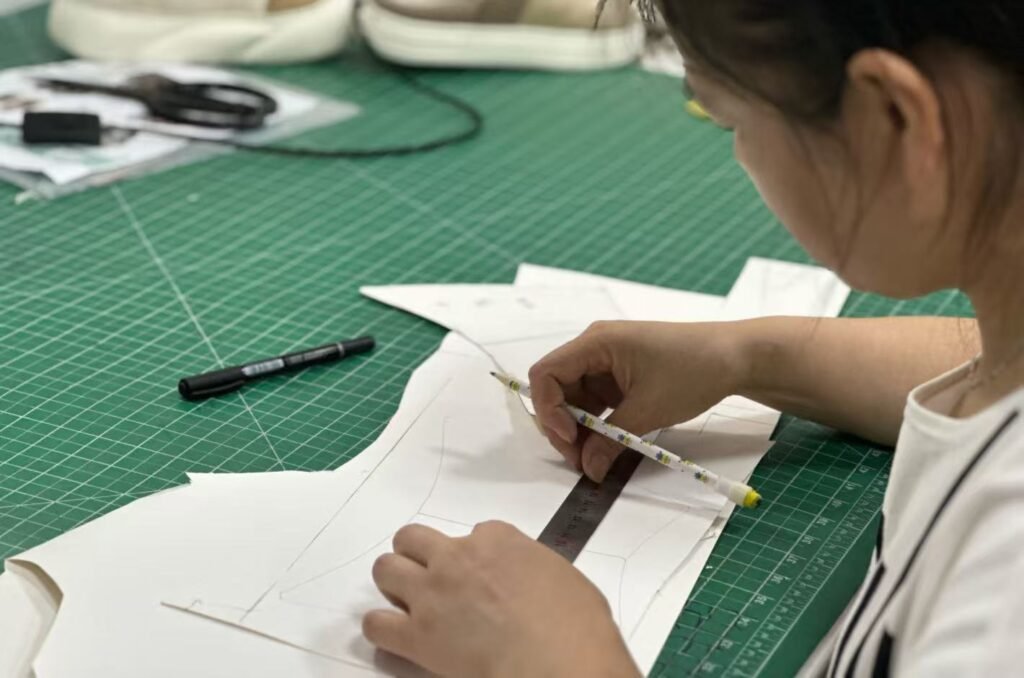
OEM/ODM
We have a team of experts who can help you find the perfect solution for your needs.

Customer Service
We’ll get you the answers to all of your questions, quickly and effectively

Easy Communication
We think in your ways. Consider your requirements in priority and how to meet them.
100+ Knowledge You Need to Know About EVA Plastic Slippers
1.What Are the Advantages of Using PVC in Slipper Production?
1. **Durability and Flexibility**
– **Advantage**: High durability and wear resistance.
– **Benefit**: Ideal for everyday and outdoor use, maintaining longevity without significant degradation.
2. **Cost-Effectiveness**
– **Advantage**: Lower cost compared to materials like leather or rubber.
– **Benefit**: Reduces production costs, making slippers more affordable for consumers.
3. **Water and Chemical Resistance**
– **Advantage**: Naturally resistant to water and various chemicals.
– **Benefit**: Easy to clean and maintain, ideal for wet environments like bathrooms and pools.
4. **Ease of Molding and Customization**
– **Advantage**: Easily molded into diverse shapes and designs.
– **Benefit**: Enables a wide range of styles, colors, and patterns in slipper production.
5. **Lightweight and Comfortable**
– **Advantage**: PVC is lightweight, enhancing wearer comfort.
– **Benefit**: Suitable for prolonged wear, especially for indoor and casual use.
6. **Recyclability**
– **Advantage**: PVC is recyclable, supporting environmental goals.
– **Benefit**: Allows manufacturers to reduce waste and promote eco-friendly practices.
2. What Are the Main Production Steps for PVC Slippers?
1. **Material Preparation**
– **Step**: Mix raw PVC with additives (plasticizers, stabilizers, pigments).
– **Purpose**: Achieve desired flexibility, durability, and color for slipper production.
2. **Injection Molding or Casting**
– **Step**: Heat and inject molten PVC into molds shaped like the slipper design.
– **Purpose**: Form sole, strap, and components efficiently, ideal for mass production.
3. **Cooling and Demolding**
– **Step**: Cool molded slippers to solidify and remove from molds.
– **Purpose**: Retain shape and prepare components for finishing.
4. **Trimming and Finishing**
– **Step**: Trim excess material and smooth any imperfections.
– **Purpose**: Ensure a clean finish and comfort in the final product.
5. **Assembly and Joining**
– **Step**: Attach components (sole, strap) using heat, adhesives, or fasteners.
– **Purpose**: Create a sturdy structure, ensuring durability and longevity.
6. **Quality Inspection**
– **Step**: Inspect slippers for dimensions, durability, and appearance.
– **Purpose**: Verify that products meet quality and safety standards.
7. **Packaging and Shipping**
– **Step**: Package, label, and prepare slippers for distribution.
– **Purpose**: Ready the product for retail display and safe transport.
3.What Are the Pros and Cons of Different Production Methods?
1. **Extrusion Molding**
– **Pros**: High efficiency for continuous production; minimal material waste; ideal for soft materials like EVA and PVC.
– **Cons**: Limited design freedom; lower precision on edges and details; requires post-processing for shape completion.
2. **Injection Molding**
– **Pros**: High precision and consistency; highly automated for mass production; supports diverse and complex designs.
– **Cons**: High mold costs, suitable mainly for large batches; potential material waste during molding; not ideal for very soft materials.
3. **Calendering**
– **Pros**: Efficient for large-area, uniform-thickness sheets; high material utilization; relatively low equipment cost.
– **Cons**: Limited to thin sheets and films; restricted to simple, flat shapes; lower precision on detailed features.
4.What Is the Typical Lifespan of PVC Slipper Molds?
1. **Standard Mold Lifespan**
– **Range**: Typically 150,000 to 300,000 cycles under normal conditions.
– **Factors**: High-quality materials and proper maintenance lead to longer life, while lower-quality molds may reduce lifespan.
2. **Impact of Design Complexity**
– **Simple Designs**: Longer lifespan, often reaching 300,000+ cycles.
– **Complex Designs**: Shorter lifespan, usually around 150,000-200,000 cycles due to faster wear.
3. **Maintenance Practices**
– **Regular Cleaning and Lubrication**: Extends mold life by preventing buildup and reducing wear.
– **Timely Repairs**: Minor damage repair can sustain mold performance and prevent major issues.
4. **Material Considerations**
– **High-Quality Steel**: Durable and wear-resistant, supporting the upper lifespan range.
– **Lower-Quality Alloys**: More prone to wear, typically resulting in a lifespan closer to the lower range.
5.What Equipment Is Commonly Used in PVC Slipper Production?
1. **Injection Molding Machine**
– **Purpose**: Molds PVC into slipper shapes through high-precision injection.
– **Use**: Ideal for producing complex, durable designs at scale.
2. **Mixing and Compounding Machine**
– **Purpose**: Blends PVC with additives for the desired flexibility, color, and softness.
– **Use**: Prepares customized compounds for specific slipper characteristics.
3. **Extrusion Machine**
– **Purpose**: Extrudes PVC into sheets or strips for soles or strap components.
– **Use**: Suitable for producing uniform materials for basic slipper parts.
4. **Cutting and Trimming Machine**
– **Purpose**: Cuts and shapes PVC parts to precise specifications.
– **Use**: Ensures clean edges and consistent shapes for comfort and aesthetics.
5. **Hydraulic Press**
– **Purpose**: Bonds different slipper components using adjustable pressure.
– **Use**: Creates durable connections between soles, uppers, and straps.
6. **Decorating and Printing Machine**
– **Purpose**: Applies logos, patterns, or designs onto slippers.
– **Use**: Adds visual appeal and branding through screen printing, heat transfer, or inkjet.
7. **Quality Inspection Equipment**
– **Purpose**: Tests hardness, flexibility, and slip resistance.
– **Use**: Ensures each batch meets quality and safety standards.
6.What Are Common Issues in the Demolding Process of PVC Slippers?
1. **Deformation**
– **Cause**: Uneven mold temperature or insufficient cooling causes incomplete setting of PVC.
– **Solution**: Ensure even and adequate cooling; adjust mold temperature and demolding time.
2. **Surface Defects (Dents or Bubbles)**
– **Cause**: Air trapped inside the mold or an uneven mold surface.
– **Solution**: Adjust injection pressure, ensure no air pockets, and regularly polish the mold surface.
3. **Sticking to the Mold**
– **Cause**: Lack of release agent on the mold or PVC formulation issues causing adhesion.
– **Solution**: Use an appropriate amount of release agent and improve PVC formulation for better flow and surface lubrication.
4. **Size Variations**
– **Cause**: Uneven pulling force or incomplete cooling during demolding.
– **Solution**: Modify the mold release structure and ensure complete setting before demolding.
5. **Demolding Marks**
– **Cause**: Incorrect demolding angle or excessive force causes scratches or indentations.
– **Solution**: Adjust demolding angle and force, and use suitable release tools or machinery.
6. **Cracks or Breakage**
– **Cause**: Uneven force application or poor mold design, causing stress on weak areas.
– **Solution**: Optimize mold design to reduce weak points and ensure even force application during demolding.
7.How Can the Surface of PVC Slippers Be Treated to Increase Gloss or Slip Resistance?
1. **Gloss Enhancement**
– **Polishing and Buffing**
– **Method**: Use buffing machines or polishing pads to create a smooth, shiny finish.
– **Effect**: Removes surface irregularities, resulting in increased gloss.
– **Glossy Coating Application**
– **Method**: Apply a clear gloss coating or lacquer to add shine.
– **Effect**: Enhances visual appeal and adds a protective layer.
– **Heat Treatment**
– **Method**: Apply heat via a heat gun or infrared treatment to smooth the surface.
– **Effect**: Provides a uniform gloss while slightly hardening the surface.
– **UV Coating**
– **Method**: Apply a UV-curable coating that hardens under UV light.
– **Effect**: Produces a durable, high-gloss finish with scratch resistance.
2. **Slip Resistance Improvement**
– **Textured Molding**
– **Method**: Use molds with textured patterns (e.g., dots, grooves) to create an anti-slip surface.
– **Effect**: Increases friction and slip resistance on the slipper sole.
– **Spray-On Anti-Slip Coating**
– **Method**: Apply a specialized anti-slip spray to the sole for added traction.
– **Effect**: Forms a textured, durable anti-slip layer, enhancing grip on smooth surfaces.
– **Rubberized Inserts or Overlays**
– **Method**: Attach rubberized pads or inserts to high-contact areas of the sole.
– **Effect**: Improves grip, especially in wet environments.
– **Abrasive Treatment or Sanding**
– **Method**: Lightly sand the sole or apply an abrasive treatment to increase roughness.
– **Effect**: Creates a non-slip effect, providing better traction in both wet and dry conditions.
8.How Is Slipper Quality Inspected During the Production Process?
1. **Raw Material Inspection**
– **Method**: Test PVC or EVA materials for density, hardness, and color consistency.
– **Purpose**: Ensures initial material quality meets specifications to prevent downstream issues.
2. **In-Process Dimensional and Shape Checks**
– **Method**: Measure dimensions with calipers and templates during molding.
– **Purpose**: Verifies each part meets size and shape standards for uniformity.
3. **Surface Quality Inspection**
– **Method**: Visually inspect for bubbles, scratches, or discoloration.
– **Purpose**: Maintains aesthetic standards with a smooth, defect-free surface.
4. **Hardness and Flexibility Testing**
– **Method**: Use a Shore durometer for hardness; bend and twist to test flexibility.
– **Purpose**: Confirms comfort levels and ensures slippers are appropriately soft or firm.
5. **Slip Resistance Test**
– **Method**: Use a friction tester to assess grip on wet and dry surfaces.
– **Purpose**: Ensures adequate traction and safety across surfaces.
6. **Abrasion Resistance Test**
– **Method**: Perform abrasion testing on the sole with rotating abrasive wheels.
– **Purpose**: Assesses durability, confirming resistance to wear under simulated conditions.
7. **Compression and Cushioning Test**
– **Method**: Apply weight or pressure to measure deformation with repeated compression.
– **Purpose**: Ensures cushioning retains its shape and provides lasting comfort.
8. **Color Fastness Test**
– **Method**: Conduct wash and UV exposure tests for fading or discoloration.
– **Purpose**: Confirms color stability and resistance to environmental factors.
9. **Final Visual and Functional Inspection**
– **Method**: Conduct a final check for defects and test comfort through flexing.
– **Purpose**: Ensures each slipper is defect-free and functions as intended before packaging.
9.# How to Ensure Durability and Abrasion Resistance of PVC Slippers?
1. **Select High-Quality PVC Material**
– **Method**: Use PVC with high molecular weight and suitable plasticizers.
– **Purpose**: Resists cracking and wear over extended use.
2. **Optimize Material Formulation**
– **Method**: Add stabilizers and UV inhibitors to the PVC formula.
– **Purpose**: Increases resistance to environmental factors that degrade durability.
3. **Use Reinforced Molding Techniques**
– **Method**: Apply consistent pressure and temperature in injection molding.
– **Purpose**: Ensures uniform material distribution, reducing weak points.
4. **Apply Anti-Abrasion Coatings**
– **Method**: Coat the sole with an anti-abrasion layer during finishing.
– **Purpose**: Provides additional protection against friction on rough surfaces.
5. **Incorporate Textured Patterns**
– **Method**: Design soles with grooves or cross-hatch patterns.
– **Purpose**: Enhances traction and reduces localized wear in high-contact areas.
6. **Perform Abrasion Resistance Testing**
– **Method**: Use standards like ISO 17707 or GB/T 3903.3 to test soles with rotating abrasive wheels.
– **Purpose**: Confirms that the sole withstands wear, meeting abrasion resistance standards.
7. **Conduct Compression and Flex Tests**
– **Method**: Test soles under repeated compression and bending.
– **Purpose**: Verifies material retention of shape and elasticity over time.
8. **UV and Environmental Testing**
– **Method**: Expose slippers to UV and environmental tests (e.g., ASTM G154).
– **Purpose**: Ensures color and structural stability under various environmental conditions.
9. **Inspect Finished Products for Consistency**
– **Method**: Perform visual and functional checks for uniform thickness, texture, and hardness.
– **Purpose**: Ensures that each pair meets durability and wear resistance specifications.
Test & Quality Control
1.How to Test Purity and Composition of PVC Raw Materials ?
1. **Fourier-Transform Infrared Spectroscopy (FTIR)**
– **Method**: Uses infrared light to detect chemical bonds and identify additives or impurities.
– **Purpose**: Provides a spectral fingerprint to verify material purity.
2. **Thermogravimetric Analysis (TGA)**
– **Method**: Heats the PVC sample gradually to measure weight loss at various temperatures.
– **Purpose**: Identifies thermal stability and the proportion of non-PVC additives.
3. **Differential Scanning Calorimetry (DSC)**
– **Method**: Measures heat flow during phase transitions, revealing composition details.
– **Purpose**: Analyzes melting behavior to detect formulation inconsistencies.
4. **X-Ray Fluorescence (XRF) Spectroscopy**
– **Method**: Uses X-ray fluorescence to detect elemental composition, including heavy metals.
– **Purpose**: Ensures compliance by identifying hazardous elements and impurities.
5. **Gas Chromatography-Mass Spectrometry (GC-MS)**
– **Method**: Analyzes volatile organic compounds (VOCs) in PVC, identifying specific additives.
– **Purpose**: Confirms the presence and quantity of plasticizers and other organics.
6. **Atomic Absorption Spectroscopy (AAS)**
– **Method**: Measures metal concentrations in PVC by detecting element-specific wavelengths.
– **Purpose**: Detects trace metals, verifying material purity for safety standards.
7. **Density and Viscosity Tests**
– **Method**: Measures density and viscosity to detect fillers or impurities.
– **Purpose**: Confirms consistency, as variations may indicate non-PVC additives.
8. **Gel Permeation Chromatography (GPC)**
– **Method**: Measures molecular weight distribution to detect degradation or contamination.
– **Purpose**: Ensures consistent molecular weight, critical for durability and processing.
2.How Are Thickness, Hardness, and Softness of PVC Slippers Controlled During Production?
1. **Controlling Thickness**
– **Precise Molding and Injection Pressure**
– **Method**: Set accurate injection pressure and mold closure force.
– **Purpose**: Ensures uniform material flow for consistent thickness.
– **Mold Design and Calibration**
– **Method**: Design and calibrate molds to maintain dimensional accuracy.
– **Purpose**: Keeps thickness uniform across production cycles.
– **In-Process Measurement**
– **Method**: Measure thickness with calipers or gauges during production.
– **Purpose**: Enables real-time adjustments to ensure consistency.
2. **Controlling Hardness**
– **Material Formulation and Additives**
– **Method**: Adjust plasticizer and stabilizer levels in the PVC mix.
– **Purpose**: Controls hardness, with more plasticizer softening the material.
– **Temperature and Cooling Control**
– **Method**: Maintain consistent temperatures and cooling rates.
– **Purpose**: Prevents hardness variation, as rapid cooling increases hardness.
– **Hardness Testing**
– **Method**: Use a Shore durometer to test slipper hardness post-production.
– **Purpose**: Ensures slippers meet hardness specifications, allowing adjustments.
3. **Controlling Softness**
– **Precise Plasticizer Levels**
– **Method**: Adjust plasticizer quantity for optimal softness.
– **Purpose**: Tailors softness to meet comfort specifications.
– **Material Thickness and Layering**
– **Method**: Add multi-layer designs or padding in specific areas.
– **Purpose**: Enhances comfort in targeted high-cushion zones.
– **Compression and Flexibility Testing**
– **Method**: Perform compression and bending tests to assess softness.
– **Purpose**: Confirms resilience and shape retention under pressure.
3.What Are the Abrasion Resistance Testing Standards for PVC Slippers?
1. **ISO 17707 (Footwear – Test Methods for Outsoles – Abrasion Resistance)**
– **Method**: Uses a rotating drum with abrasive paper; PVC sole is pressed against it under load, measuring material loss after rotations.
– **Criteria**: Material loss (in mm³) must be below specified thresholds for durability.
2. **GB/T 3903.3 (Chinese National Standard for Footwear – Abrasion Resistance)**
– **Method**: Sole pressed against an abrasive wheel; volume or thickness of material lost measured after set cycles.
– **Criteria**: Ensures material loss remains within specified limits, meeting Chinese quality standards.
3. **DIN 53516 (German Standard for Rubber and Plastic Abrasion Testing)**
– **Method**: PVC sample placed on abrasive surface under controlled pressure and rotated; material worn away measured in mm³.
– **Criteria**: Abrasion loss must be below defined values, ensuring wear resistance.
4. **ASTM D1630 (Standard Test Method for Rubber Property – Abrasion Resistance)**
– **Method**: Slipper sole subjected to abrasive contact under set conditions, with material loss measured post-test.
– **Criteria**: Sets limits on material loss to ensure compliance with U.S. durability standards.
4.How to Test Flexibility and Tensile Strength of PVC Slippers?
1. **Bending (Flexibility) Testing**
– **Standard**: ISO 24233 (Footwear – Test Methods for Outsoles – Flexing Resistance) or GB/T 3903.1
– **Method**: Use a flexing machine to bend the slipper sole repeatedly at a set angle, simulating walking cycles.
– **Measurement**: Check for cracks, tears, or deformation after thousands of flex cycles.
– **Criteria**: Ensures the sole retains flexibility without structural damage, supporting durability through repeated bending.
2. **Tensile Strength Testing**
– **Standard**: ISO 37 (Rubber, Vulcanized or Thermoplastic – Determination of Tensile Stress-Strain Properties) or ASTM D412
– **Method**: Place a standardized PVC sample in a tensile testing machine, applying force until it breaks to measure maximum force and elongation.
– **Measurement**: Tensile strength in MPa and elongation percentage, showing resistance to stretching.
– **Criteria**: Confirms PVC’s ability to withstand tearing and stretching during normal use, ensuring longevity.
3. **Additional Elongation and Tear Testing**
– **Tear Resistance Standard**: ISO 34-1 or ASTM D624
– **Measurement**: Tests resistance to tearing at notches or stress points.
– **Purpose**: Ensures the slipper remains intact and resilient, even with pressure at vulnerable sections like straps.
5.How to Test Slip Resistance of Slippers ?
1. **Dynamic Coefficient of Friction (COF) Testing**
– **Standard**: ISO 13287 (Footwear – Test Method for Slip Resistance) or ASTM F2913
– **Method**: Measures COF by moving the slipper sole across a test surface (e.g., ceramic tile, steel) under wet and dry conditions.
– **Measurement**: Higher COF values indicate better slip resistance.
– **Criteria**: Must meet minimum COF thresholds (e.g., 0.3-0.6) to ensure safety.
2. **Oil and Water Resistance Testing**
– **Standard**: Often part of ISO 13287 or custom protocols.
– **Method**: Tests slipper sole on wet or oil-coated surfaces to simulate slippery conditions.
– **Measurement**: Observes traction stability under wet or oily environments.
– **Criteria**: Ensures slippers maintain grip in moisture-rich settings.
3. **Pendulum Test**
– **Standard**: BS EN 16165 or ASTM E303 (Standard Test Method for Measuring Surface Frictional Properties)
– **Method**: A pendulum with a rubber slider swings across the slipper sole on wet or dry surfaces, measuring frictional resistance.
– **Measurement**: Provides a Pendulum Test Value (PTV), where higher values indicate better slip resistance.
– **Criteria**: Many industries require a minimum PTV (e.g., >36) for acceptable slip resistance.
4. **Whole Shoe Testing**
– **Standard**: Custom protocols or industry-specific standards.
– **Method**: Tests the entire slipper under real-life conditions (e.g., incline or wet/dry surface walking).
– **Measurement**: Assesses stability, friction, and traction during real-world use.
– **Criteria**: Provides practical performance data, ensuring slipper safety in everyday environments.
6.How to Test High-Temperature Resistance of PVC Slippers?
1. **Heat Aging Test**
– **Standard**: ISO 188 (Rubber, Vulcanized or Thermoplastic – Accelerated Aging Test)
– **Method**: Place slippers in an oven (50°C – 100°C) for 24-72 hours.
– **Measurement**: Inspect for warping, discoloration, cracking, or degradation.
– **Criteria**: Slippers should retain shape, flexibility, and structural integrity.
2. **Dimensional Stability Testing**
– **Method**: Measure slipper dimensions before and after high-temperature exposure.
– **Purpose**: Ensures PVC material does not expand or shrink excessively.
– **Criteria**: Dimensional changes should be within acceptable limits for usability.
3. **Compression Set Test**
– **Standard**: ISO 815 or ASTM D395 (Standard Test Methods for Rubber Property – Compression Set)
– **Method**: Apply compressive load on heated PVC sample, then measure deformation.
– **Measurement**: Assesses permanent compression or indentation.
– **Criteria**: Minimal permanent deformation indicates durability under heat.
4. **Thermogravimetric Analysis (TGA)**
– **Method**: Gradually heat a PVC sample to detect the temperature at which it begins to degrade.
– **Purpose**: Identifies thermal stability and degradation point of PVC.
– **Criteria**: High resistance if material maintains mass below critical temperatures.
5. **UV-Heat Combined Aging Test**
– **Standard**: ASTM G154 (UV and Heat Exposure Test for Nonmetallic Materials)
– **Method**: Expose slippers to UV and high temperatures to simulate hot, sunny conditions.
– **Measurement**: Observe changes in color, cracking, or surface degradation.
– **Criteria**: Slippers should resist fading and material breakdown for sun-exposed environments.
7.How Are Harmful Plasticizers Detected in PVC Slippers?
1. **Gas Chromatography-Mass Spectrometry (GC-MS)**
– **Method**: Extract a sample from the PVC and analyze it using GC-MS, separating and identifying compounds by mass.
– **Purpose**: Detects and quantifies specific plasticizers like phthalates (e.g., DEHP, DBP).
– **Criteria**: Ensures compliance with limits such as <0.1% for restricted phthalates under EU REACH.
2. **Fourier-Transform Infrared Spectroscopy (FTIR)**
– **Method**: Scans the PVC sample to detect chemical bonds characteristic of common plasticizers.
– **Purpose**: Provides a fast, non-destructive method for initial screening of plasticizers.
– **Criteria**: Identifies chemical bonds (e.g., C=O) found in harmful plasticizers, prompting further testing if necessary.
3. **High-Performance Liquid Chromatography (HPLC)**
– **Method**: Extract the sample in a solvent and analyze using HPLC for separation and quantification.
– **Purpose**: Effective for non-volatile plasticizers, providing high accuracy.
– **Criteria**: Confirms plasticizer levels within regulatory safety limits.
4. **X-Ray Fluorescence (XRF) Screening**
– **Method**: Uses X-ray fluorescence to screen for elements associated with certain plasticizers, particularly heavy metals.
– **Purpose**: Screens for elements that may indicate restricted plasticizers.
– **Criteria**: Detects non-compliant compounds, especially heavy-element-based plasticizers.
5. **Thermal Desorption-GC-MS (TD-GC-MS)**
– **Method**: Heats the PVC sample to release volatile compounds, which are analyzed by GC-MS.
– **Purpose**: Detects harmful plasticizers that may volatilize, simulating real-life exposure.
– **Criteria**: Confirms that no hazardous chemicals are emitted at high temperatures.
6. **Regulatory Compliance Testing (e.g., REACH, ROHS)**
– **Method**: Tests according to EU REACH or ROHS guidelines, specifying safe plasticizer levels.
– **Purpose**: Ensures legal compliance with plasticizer content standards in international markets.
– **Criteria**: Confirms plasticizer levels are below legally permissible limits (e.g., <0.1% for certain phthalates).
8.How Is the Antibacterial Performance of Slippers Evaluated in Moist Environments?
1. **Antibacterial Activity Testing (ISO 22196 / JIS Z 2801)**
– **Method**: Apply a bacterial suspension (e.g., *Staphylococcus aureus*, *Escherichia coli*) to the slipper surface, incubate, and measure bacterial growth reduction.
– **Measurement**: Compare bacterial counts before and after incubation.
– **Criteria**: A reduction of 99% or higher indicates effective antibacterial performance.
2. **Zone of Inhibition Test (Agar Diffusion Method)**
– **Method**: Place a bacterial culture on agar, then position the slipper material on top to observe bacterial inhibition.
– **Measurement**: Measure the clear zone around the sample.
– **Criteria**: Larger inhibition zones confirm the presence of active antibacterial agents.
3. **Moisture Retention and Drying Rate Testing**
– **Method**: Assess moisture retention and drying speed of the slipper in a controlled humidity setting.
– **Purpose**: Evaluates how long the slipper remains damp, affecting bacterial growth.
– **Criteria**: Low moisture retention and fast drying support antibacterial effectiveness.
4. **Odor Control Testing**
– **Method**: Place slippers in a humid environment with bacterial cultures to observe odor development.
– **Measurement**: Monitor odor intensity over time as an indirect measure of bacterial resistance.
– **Criteria**: Reduced odor indicates effective bacterial inhibition, as less bacterial activity produces less odor.
5. **Long-Term Use Simulation (Accelerated Aging Test)**
– **Method**: Expose slippers to repeated wet-dry cycles to simulate long-term antibacterial performance.
– **Purpose**: Ensures antibacterial properties remain effective over time.
– **Criteria**: Consistent performance through multiple cycles indicates durable antibacterial treatment.
6. **Environmental Compliance (EPA, EU Biocidal Products Regulation)**
– **Method**: Test for compliance with regulations on antibacterial agents for safety and environmental standards.
– **Purpose**: Verifies use of safe, approved antibacterial agents.
– **Criteria**: Only permitted agents and concentrations should be present to meet regulatory compliance.
9.How to Conduct VOC Testing ?
、1. **Thermal Desorption-Gas Chromatography-Mass Spectrometry (TD-GC-MS)**
– **Method**: Heat the slipper sample to release VOCs, which are then analyzed with GC-MS to identify and quantify specific compounds.
– **Purpose**: Detects and measures VOCs, such as formaldehyde or phthalates, that could be harmful.
– **Criteria**: Ensures that VOC emissions remain below regulatory limits for consumer safety.
2. **Chamber Testing (ISO 16000 Series)**
– **Method**: Place the slippers in a controlled chamber to measure VOCs released into the air over a set time.
– **Purpose**: Simulates VOC emissions in real-life conditions, such as indoor environments.
– **Criteria**: Confirms that VOC emissions fall within safe indoor air quality limits.
3. **Headspace Analysis**
– **Method**: Place a sample in a sealed container and heat it, allowing VOCs to accumulate in the air above the sample (headspace), which is then analyzed.
– **Purpose**: Measures VOCs that are likely to release during storage or use.
– **Criteria**: Ensures low VOC levels, reducing health risks for consumers.
4. **Regulatory Compliance Testing (e.g., REACH, California Prop 65)**
– **Method**: Test for compliance with regulatory standards limiting VOCs and harmful chemicals.
– **Purpose**: Verifies that the slippers meet international safety requirements, especially for substances like phthalates, formaldehyde, and other restricted VOCs.
– **Criteria**: Confirms the slippers are within allowable VOC limits set by regulations to ensure consumer safety.
5. **Total Volatile Organic Compounds (TVOC) Measurement**
– **Method**: Measure the total concentration of VOCs released by the slipper over a set period.
– **Purpose**: Provides a broad assessment of all VOC emissions rather than specific compounds.
– **Criteria**: Ensures total VOCs are below safety thresholds, reducing cumulative exposure risks.
10.How to Ensure Finished PVC Slippers Odor-Free?
1. **High-Quality Raw Material Selection**
– **Method**: Use high-purity, low-VOC PVC materials and avoid additives with strong odors.
– **Purpose**: Minimizes off-gassing compounds that could lead to unpleasant odors.
– **Benefit**: High-quality materials create a foundation for odor-free products.
2. **Low-VOC and Non-Toxic Additives**
– **Method**: Select low-VOC plasticizers and odor-neutral additives.
– **Purpose**: Reduces the emission of volatile organic compounds (VOCs) that cause odors.
– **Benefit**: Ensures slippers remain safe and odor-free during use.
3. **Optimized Curing and Heating Processes**
– **Method**: Adjust curing and cooling times to allow full evaporation of residual odors.
– **Purpose**: Prevents trapped VOCs from creating odors post-production.
– **Benefit**: Proper curing ensures a fresh, neutral-smelling final product.
4. **Incorporate Deodorizing Agents**
– **Method**: Add odor-absorbing or deodorizing agents during the compounding stage.
– **Purpose**: Neutralizes or absorbs potential odors directly in the material.
– **Benefit**: Reduces the chance of odors at the source, enhancing product appeal.
5. **Airing and Post-Production Ventilation**
– **Method**: Allow slippers to air out in a well-ventilated area post-production.
– **Purpose**: Releases any remaining volatile compounds before packaging.
– **Benefit**: Ensures a fresh-smelling product by dissipating residual odors.
6. **VOC and Odor Testing**
– **Method**: Use Thermal Desorption-GC-MS or Headspace Analysis to detect residual VOCs.
– **Purpose**: Confirms that odor-causing compounds are within safe and undetectable levels.
– **Benefit**: Guarantees the slippers meet odor and safety standards.
7. **Packaging with Odor Control**
– **Method**: Use odor-neutral packaging materials or include odor-absorbing inserts.
– **Purpose**: Prevents residual odors from being trapped during storage and shipping.
– **Benefit**: Ensures the product remains fresh-smelling upon delivery to consumers.
Price Structure
1.How Much Do PVC Material Costs Vary by Origin or Batch?
1. **Geographical Price Differences**
– **Range**: PVC prices can vary by up to **20-40%** depending on the production region.
– **Influence**: Regions with lower labor costs and closer proximity to raw material sources typically offer lower prices.
– **Example**: PVC produced in Southeast Asia often costs less than that from North America due to cheaper production inputs.
2. **Batch-to-Batch Price Variability**
– **Range**: Price changes between batches may vary by **5-15%**, influenced by production costs and demand.
– **Influence**: Fluctuations in raw materials (e.g., ethylene and chlorine) and energy prices directly impact production costs, affecting individual batches.
– **Example**: Price spikes in oil can increase PVC production costs, as ethylene is derived from petroleum.
3. **Raw Material Price Volatility**
– **Range**: Fluctuations in ethylene and chlorine, the main inputs for PVC, significantly affect prices.
– **Influence**: Oil and natural gas price changes impact ethylene costs, while supply chain disruptions in chlorine can lead to price variability.
– **Example**: An oil price increase may lead to higher PVC prices globally due to increased ethylene costs.
4. **Quality and Grade of PVC**
– **Range**: Specialty PVC grades (e.g., medical or high-performance grades) may cost **20-50%** more than standard grades.
– **Influence**: Higher-grade PVC undergoes additional processing and quality control, making it more expensive.
– **Example**: Slippers requiring enhanced flexibility or durability may require higher-grade PVC, impacting material costs.
5. **Supply and Demand Dynamics**
– **Range**: High demand or limited supply in specific regions can push prices up by **10-30%**.
– **Influence**: Seasonal demand spikes, regional shortages, or increased global demand affect pricing.
– **Example**: Increased demand for plastic products can drive up PVC prices during peak production periods.
6. **Regulatory and Tariff Impacts**
– **Range**: Import/export tariffs and environmental regulations can increase costs by **5-25%** depending on the region.
– **Influence**: Tariffs on PVC imports or strict environmental standards can drive up prices, particularly in regulated markets.
– **Example**: Import tariffs in the EU or environmental compliance costs in the U.S. may make locally sourced PVC more expensive.
2.What Is the Cost Proportion of Additives (e.g., Plasticizers, Stabilizers) Used in PVC Modification?
1. **Plasticizers**
– **Cost Proportion**: Typically **30-50%** of the total material cost.
– **Purpose**: Enhance flexibility, softness, and durability in PVC products like slippers.
– **Example**: Common plasticizers like DEHP or DINP are essential for pliability, making them a major cost component.
2. **Stabilizers**
– **Cost Proportion**: Around **10-20%** of the total material cost.
– **Purpose**: Increase thermal stability and UV resistance, preventing degradation.
– **Example**: Heat stabilizers (e.g., calcium-zinc stabilizers) ensure PVC can withstand processing temperatures and prolonged use, particularly for outdoor products.
3. **Fillers**
– **Cost Proportion**: Roughly **5-15%** of the total material cost.
– **Purpose**: Reduce material costs, increase durability, and add bulk without compromising flexibility.
– **Example**: Calcium carbonate is commonly used to reduce the overall cost per unit of PVC by increasing volume.
4. **Colorants and Pigments**
– **Cost Proportion**: Typically **1-5%** of the total material cost.
– **Purpose**: Add color and aesthetic appeal to PVC slippers.
– **Example**: Organic and inorganic pigments are chosen based on color stability, with lighter colors often costing less than intense pigments.
5. **Flame Retardants (if applicable)**
– **Cost Proportion**: Approximately **5-10%** of the total material cost, used as needed for specific safety standards.
– **Purpose**: Enhance fire resistance for applications requiring additional safety features.
– **Example**: Additives like antimony trioxide are used where higher flame resistance is mandated, such as in certain industrial footwear.
6. **Processing Aids and Lubricants**
– **Cost Proportion**: Generally **1-3%** of the total material cost.
– **Purpose**: Improve processing flow, reduce friction, and enhance mold release.
– **Example**: Lubricants like stearates prevent sticking during molding, facilitating smoother production.
3.What Are the Cost Differences for Injection Molding, Compression Molding, or Blow Molding?
1. **Injection Molding**
– **Cost Range**: Higher initial costs, typically **20-30%** higher than compression or blow molding for setup and tooling.
– **Advantages**: High precision, suitable for complex designs, and efficient for large production volumes.
– **Operational Cost**: Due to automation, labor costs are lower in high-volume production; however, energy consumption is moderate to high.
– **Per-Unit Cost**: More cost-effective per unit in large-scale production, with lower waste due to precision.
– **Best For**: High-volume runs, complex designs, and products requiring detailed features.
2. **Compression Molding**
– **Cost Range**: Generally **10-20%** lower initial setup costs compared to injection molding, due to simpler molds.
– **Advantages**: Cost-effective for moderate to high volumes with relatively low material waste.
– **Operational Cost**: Lower energy consumption, though labor costs can be higher due to manual loading and unloading.
– **Per-Unit Cost**: Lower for medium-volume production, especially for simpler designs.
– **Best For**: Less complex shapes, medium production volumes, and products where high precision isn’t critical.
3. **Blow Molding**
– **Cost Range**: Lower tooling costs, often **20-30%** less than injection molding, as molds are less complex.
– **Advantages**: Ideal for hollow products and designs with limited complexity, minimal material waste.
– **Operational Cost**: Generally low energy and labor costs; ideal for simpler shapes and products that don’t require high detail.
– **Per-Unit Cost**: Most economical per unit for hollow or simple shapes, particularly at high production volumes.
– **Best For**: High-volume production of simple, hollow designs with minimal complexity.
#
4.How to Calculate Electricity Consumption in the Production Process?
1. **Identify Equipment Power Ratings**
– **Method**: Check the power rating (in kW) for each machine involved in production.
– **Example**: An injection molding machine rated at 50 kW, and heating equipment at 10 kW.
2. **Calculate Operating Time**
– **Method**: Determine the operating hours for each machine per day or per production cycle.
– **Example**: Injection molding machine runs for 8 hours a day.
3. **Calculate Power Consumption per Machine**
– **Formula**:
\[
\text{Power Consumption (kWh)} = \text{Power Rating (kW)} \times \text{Operating Time (h)}
\]
– **Example**: If the injection molding machine (50 kW) operates for 8 hours:
\[
50 \, \text{kW} \times 8 \, \text{hours} = 400 \, \text{kWh}
\]
4. **Sum Power Consumption for All Equipment**
– **Method**: Add up the power consumption of each machine to find the total electricity used in production.
– **Example**: Injection molding machine (400 kWh) + heating equipment (80 kWh) + other machines (60 kWh) = 540 kWh total.
5. **Calculate Total Electricity Cost**
– **Formula**:
\[
\text{Total Cost} = \text{Total kWh} \times \text{Electricity Rate (per kWh)}
\]
– **Example**: At an electricity rate of $0.12 per kWh:
\[
540 \, \text{kWh} \times 0.12 = \$64.80
\]
5.What Are the Production and Maintenance Costs for PVC Slipper Molds?
1. **Mold Production Cost**
– **Range**: Typically **$5,000 to $15,000** per mold, depending on complexity, size, and material quality.
– **Influencing Factors**: Complex designs, multi-cavity molds, and high-quality materials (like hardened steel) increase the cost.
– **Example**: Simple single-cavity molds for basic slipper designs may cost around $5,000, while multi-cavity molds for complex designs can reach $15,000 or more.
– **Lifespan**: Molds usually last **150,000 to 300,000 cycles** before replacement is needed, impacting long-term cost efficiency.
2. **Maintenance Cost**
– **Regular Maintenance**: Usually around **5-10% of the mold’s initial cost per year**.
– **Activities**: Includes cleaning, lubrication, inspection, and minor repairs to prevent wear and prolong mold life.
– **Example**: For a $10,000 mold, annual maintenance would range between $500 and $1,000.
– **Major Repairs**: Costs can be **10-30% of the mold’s initial cost** for more intensive repairs, such as polishing, refitting parts, or repairing cracks.
– **Frequency**: Often required every **1-2 years**, depending on production intensity and mold quality.
3. **Replacement Cost**
– **Range**: After the mold reaches the end of its life cycle (typically 150,000-300,000 cycles), replacement is required.
– **Factors**: Choosing high-quality molds with a longer lifespan can offset the replacement frequency, making them more cost-effective over time.
4. **Downtime Costs During Maintenance**
– **Impact**: Maintenance and repairs may require machine downtime, which affects productivity and can indirectly increase costs.
– **Mitigation**: Scheduling maintenance during low-demand periods can help minimize production interruptions.
6.How Many Proportion Do Labor Force Costs?
1. **General Labor Cost Range**
– **Typical Proportion**: Labor costs often represent **10-30% of the total production cost**.
– **Variation by Region**: In regions with higher wages (e.g., North America, Europe), labor costs can reach the upper range or exceed 30%. In lower-cost regions (e.g., Southeast Asia), labor costs tend to fall between 10-20%.
2. **Influencing Factors**
– **Automation Level**: Highly automated production lines have lower labor costs, often **5-10%** of the total cost, as machines handle most tasks.
– **Production Volume**: High production volumes spread labor costs over more units, reducing per-unit labor cost impact.
– **Complexity of Process**: Labor-intensive processes (e.g., detailed assembly, custom finishing) increase labor costs to the higher end of the range.
3. **Breakdown by Labor Type**
– **Direct Labor**: Workers directly involved in manufacturing, such as assembly line operators, often account for **60-80% of total labor costs**.
– **Indirect Labor**: Includes supervisory, quality control, and maintenance staff, representing **20-40% of labor costs**.
4. **Industry-Specific Trends**
– **Footwear and Apparel**: Labor-intensive industries like footwear manufacturing generally have higher labor cost proportions, around **20-30%** of total costs.
– **Highly Automated Sectors**: In industries with advanced automation (e.g., electronics manufacturing), labor costs may drop below **10%**.
5. **Impact on Overall Cost Structure**
– **Cost Optimization**: Reducing manual labor through automation and optimizing workflow can significantly lower labor’s share of total costs.
– **Product Pricing**: High labor costs impact pricing, so manufacturers often balance labor expenses with automation investments for competitiveness.
7.How Does Hourly Slipper Production Volume Affect Costs?
1. **Fixed Cost Allocation**
– **Effect**: Higher hourly production volume reduces the per-unit fixed cost by spreading expenses (e.g., equipment depreciation, rent) over more units.
– **Example**: If equipment costs $500 per hour to operate, producing 100 pairs per hour results in a fixed cost of $5 per pair. Increasing to 200 pairs per hour drops the fixed cost to $2.50 per pair.
– **Result**: High production volumes optimize fixed cost efficiency, significantly lowering the per-pair cost.
2. **Labor Efficiency**
– **Effect**: As production volume increases, labor costs per unit decrease because more units are produced with the same labor input.
– **Example**: If labor costs $30 per hour and production is 60 pairs per hour, the labor cost per pair is $0.50. Doubling output to 120 pairs reduces labor cost per pair to $0.25.
– **Result**: Higher output improves labor efficiency, reducing per-unit labor costs.
3. **Energy Consumption and Efficiency**
– **Effect**: Energy costs per unit decrease as production volume rises, as equipment runs continuously with fewer stops and starts, improving energy efficiency.
– **Example**: If energy costs are $20 per hour, producing 50 pairs per hour results in an energy cost of $0.40 per pair. Producing 100 pairs reduces this to $0.20 per pair.
– **Result**: Higher production rates reduce energy costs per unit, benefiting total cost efficiency.
4. **Material Utilization**
– **Effect**: Higher production rates improve material utilization, minimizing material waste and optimizing bulk purchasing power.
– **Example**: Consistent, high-volume production allows for optimal ordering and use of materials, reducing cost per unit.
– **Result**: Better material efficiency lowers the per-pair material cost, benefiting overall production cost.
5. **Maintenance and Downtime**
– **Effect**: Higher production volume may increase wear on equipment, potentially increasing maintenance costs. However, efficient scheduling can offset these impacts.
– **Example**: More frequent production runs may increase minor maintenance needs, but efficient preventive maintenance reduces long-term downtime costs.
– **Result**: Balancing high production rates with scheduled maintenance prevents cost spikes from unplanned downtime.
6. **Economies of Scale**
– **Effect**: As production volume increases, economies of scale reduce the overall per-unit cost across all cost categories (fixed, variable, and marginal costs).
– **Example**: Bulk purchasing discounts for materials and energy savings result in a lower total production cost per unit.
– **Result**: Higher hourly production volume leverages economies of scale, improving profitability by lowering overall costs.
8.How Do Packaging, Storage, and Transportation Costs Affect the Pricing?
1. **Packaging Costs**
– **Components**: Includes costs for boxes, bags, inserts, and any branding elements (e.g., logos, tags).
– **Effect on Pricing**: Adds **5-10%** to the final product cost, depending on the complexity and quality of packaging.
– **Example**: Eco-friendly or branded packaging may cost more but can enhance perceived value, supporting a higher price point.
– **Result**: Packaging costs are passed to the customer, affecting pricing based on the product’s branding and quality perception.
2. **Storage Costs**
– **Components**: Includes warehousing costs, such as rent, utilities, and handling fees, which depend on storage duration and volume.
– **Effect on Pricing**: Adds **2-5%** to the final cost, with longer storage times increasing per-unit costs.
– **Example**: Seasonal inventory may require extended storage, raising the cost per unit and affecting the final price.
– **Result**: Higher storage costs increase unit costs, especially for items stored long-term, impacting pricing flexibility.
3. **Transportation Costs**
– **Components**: Covers expenses for shipping materials from the factory to warehouses or retail locations, including fuel, logistics, and freight charges.
– **Effect on Pricing**: Can add **5-15%** to the final price, influenced by shipping distance, volume, and method (air, sea, land).
– **Example**: International shipping increases costs more than domestic, directly impacting final retail prices.
– **Result**: Transport expenses, especially for long-distance or expedited shipping, significantly affect the final price, often leading to higher prices for distant markets.
4. **Volume and Weight Efficiency**
– **Influence**: Efficient packaging design reduces storage and shipping costs by maximizing volume use and minimizing weight.
– **Effect**: Bulk packaging and lightweight materials lower per-unit costs, benefiting final pricing.
– **Result**: Streamlined packaging can keep final pricing competitive by reducing both storage and shipping expenses.
5. **Demand-Based Pricing Adjustments**
– **Influence**: High packaging, storage, and transportation costs can impact demand if prices exceed consumer expectations.
– **Strategy**: Adjust pricing strategies based on seasonal demand or regional logistics costs to maintain market competitiveness.
– **Result**: Managing logistics costs enables pricing flexibility, supporting market demand without overburdening final prices.
6. **Environmental and Regulatory Compliance**
– **Influence**: Eco-friendly packaging or compliance with regional regulations may increase packaging costs but can justify premium pricing.
– **Effect**: Additional costs for sustainable packaging or regulatory compliance often increase the final price.
– **Result**: Customers may accept higher prices for sustainable products, aligning with eco-conscious brand positioning.
Price Setting
1.What Factors Determine a Reasonable Price Range for the Mid-Range Market?
1. **Material Quality and Durability**
– **Quality Standards**: Materials used in mid-range products must balance quality and cost, typically using standard-grade PVC with durability but not luxury-level materials.
– **Impact on Pricing**: Material choice should offer a good feel and durability without significant premium costs.
– **Result**: Reasonable pricing in mid-range products aligns with quality that feels robust and long-lasting, generally supporting prices in the affordable range without sacrificing performance.
2. **Design Appeal and Aesthetics**
– **Trend Adaptation**: Design should reflect popular styles and trends to attract consumers looking for both quality and current fashion, without excessive customization.
– **Feature Balancing**: Simple but attractive features, like basic textures or color options, appeal to mid-market customers without luxury costs.
– **Result**: Offering trend-aligned designs adds value, allowing mid-range products to price competitively while appealing to fashion-conscious buyers.
3. **Brand Perception and Market Positioning**
– **Brand Image**: A brand targeting the mid-range market should project reliability, quality, and a modern aesthetic without appearing too exclusive.
– **Consumer Trust**: Customers in this range prioritize reputable brands that promise solid quality, influencing their willingness to pay slightly higher than budget options.
– **Result**: Brand perception supports pricing within the mid-range by fostering trust, as customers view the brand as delivering quality without the luxury markup.
4. **Functional Features**
– **Added Value Features**: Basic features like non-slip soles, lightweight designs, or odor control justify a reasonable mid-range price.
– **No Excessive Extras**: Avoid unnecessary luxury features to keep production costs manageable.
– **Result**: Functional features enhance perceived value, allowing for mid-range pricing by offering practical benefits that consumers value.
5. **Cost of Packaging and Presentation**
– **Balanced Packaging**: Use quality, functional packaging that protects the product while appearing appealing, without premium elements like elaborate unboxing experiences.
– **Sustainable Choices**: Simple, eco-friendly packaging can attract mid-range customers who value sustainable practices at a reasonable price.
– **Result**: Practical packaging supports mid-range pricing by meeting consumer expectations without additional luxury costs.
6. **Competitive Market Analysis**
– **Benchmark Pricing**: Analyze similar products in the mid-market segment to determine an optimal price range that remains competitive.
– **Pricing Flexibility**: Mid-range pricing should allow room for discounts or promotions, which are expected in this market segment.
– **Result**: Market analysis ensures pricing aligns with competitors, maximizing appeal within the target market and remaining attractive to price-sensitive consumers.
7. **Production and Operational Costs**
– **Efficiency in Manufacturing**: Using efficient processes, such as automated production, reduces per-unit costs, allowing for profitable mid-range pricing.
– **Labor and Overheads**: Balancing operational costs without compromising on quality helps maintain an accessible price point.
– **Result**: Streamlined production keeps costs low, enabling affordable pricing while maintaining quality standards.
2.How Can Costs Be Reduced in the Low-End Market to Maintain Competitiveness?
1. **Use Cost-Effective Materials**
– **Standard-Grade PVC**: Opt for affordable, lower-grade PVC materials that provide basic functionality without premium quality.
– **Fewer Additives**: Minimize the use of costly additives, such as high-end plasticizers or stabilizers, while meeting essential quality requirements.
– **Result**: Using budget-friendly materials reduces overall material costs, making the product more affordable for low-end consumers.
2. **Simplify Design and Features**
– **Basic Design**: Focus on simple, functional designs that avoid complex shapes, patterns, or color customizations.
– **Limit Features**: Provide essential features only, like basic slip-resistance, while avoiding additional comfort layers or decorative elements.
– **Result**: Simplified design and features lower production complexity, reducing manufacturing costs.
3. **Optimize Production Efficiency**
– **Automate Processes**: Use automated machinery where possible to reduce labor costs and increase production speed.
– **High-Speed Molding**: Choose fast, high-volume processes like injection molding that yield more units per hour, minimizing per-unit costs.
– **Result**: Efficient production processes reduce labor and operational costs, supporting lower pricing.
4. **Streamline Packaging**
– **Basic Packaging Materials**: Use simple, low-cost packaging like poly bags or thin cardboard boxes without decorative elements.
– **Bulk Packaging**: Package products in bulk to minimize individual packaging costs and reduce shipping volume.
– **Result**: Streamlined packaging reduces both material and handling costs, aligning with budget-conscious consumer expectations.
5. **Source Materials Locally**
– **Local Suppliers**: Minimize import costs by sourcing PVC and other materials locally, reducing transportation expenses and import tariffs.
– **Long-Term Supplier Contracts**: Negotiate fixed-price contracts with suppliers to manage costs over time and reduce price volatility.
– **Result**: Local sourcing and stable pricing agreements help lower material costs and stabilize pricing for low-end markets.
6. **Reduce Overheads and Operational Costs**
– **Energy and Utility Efficiency**: Implement energy-saving practices to reduce electricity costs in production.
– **Labor Cost Management**: Use a lean workforce or employ part-time labor during peak production periods to control labor expenses.
– **Result**: Lower operational costs allow for competitive pricing without sacrificing essential product quality.
7. **Bulk Production and Economies of Scale**
– **High-Volume Orders**: Produce in larger quantities to leverage economies of scale, reducing per-unit costs across all production stages.
– **Batch Manufacturing**: Plan production in large batches to maximize material utilization and minimize setup costs.
– **Result**: Bulk production spreads fixed costs over a larger volume, significantly reducing the cost per unit.
8. **Minimal Branding and Marketing**
– **Generic Branding**: Use minimal branding that keeps design costs low while maintaining a recognizable logo or simple label.
– **Basic Marketing Channels**: Focus on cost-effective marketing strategies, such as in-store promotions, rather than costly advertising campaigns.
– **Result**: Reducing branding expenses lowers total costs, allowing more competitive pricing in the low-end market.
3.What Are Common Promotional and Discount Strategies During Off-Peak Seasons
1. **Seasonal Discounts**
– **Approach**: Offer discounts during off-seasons (e.g., winter sales for summer items like slippers) to maintain cash flow and clear out older inventory.
– **Example**: A 20-30% off discount encourages customers to purchase items out of season, effectively managing inventory.
– **Result**: Reduces holding costs and minimizes stockpile by moving seasonal products before new inventory arrives.
2. **Bundle Deals**
– **Approach**: Package slower-moving products with popular items at a combined discounted price (e.g., “Buy one, get one 50% off” or “3-for-2 deals”).
– **Example**: Pair PVC slippers with complementary items like socks or shoe bags to increase overall sales volume.
– **Result**: Increases average order value while moving excess stock.
3. **Flash Sales and Limited-Time Offers**
– **Approach**: Run short-term, high-impact promotions to create urgency and stimulate immediate purchases.
– **Example**: Offer a 24-hour flash sale with deep discounts (up to 50%) on select inventory items to attract impulse buyers.
– **Result**: Quickly clears excess inventory and attracts attention, driving short-term sales spikes.
4. **Bulk Purchase Discounts**
– **Approach**: Offer discounts for customers who buy in larger quantities (e.g., “Buy 5 pairs, get 25% off”).
– **Example**: Encourage customers to stock up by providing discounts on multiple purchases, making it attractive to buy more.
– **Result**: Reduces stock by increasing per-transaction volume, effective for moving large quantities of low-cost items.
5. **Loyalty and Membership Discounts**
– **Approach**: Reward loyal customers or members with exclusive discounts during off-peak times or for older inventory.
– **Example**: Send special discount codes to loyalty program members or email subscribers for early access to sales.
– **Result**: Builds brand loyalty while providing an incentive for frequent customers to buy out-of-season stock.
6. **Free Shipping and Minimum Spend Discounts**
– **Approach**: Offer free shipping for orders that reach a certain amount, encouraging customers to buy more to qualify.
– **Example**: “Free shipping on orders over $50” motivates customers to add extra items, helping reduce excess inventory.
– **Result**: Increases average order value while providing value to the customer, making it easier to clear out stock.
7. **Clearance and Outlet Sales**
– **Approach**: Mark down older or excess inventory items heavily, sometimes placing them in a separate “clearance” or “outlet” section.
– **Example**: Create a dedicated clearance section online or in-store with discounts of 50% or more.
– **Result**: Clearly signals that items are final sale, helping move stock that may be discontinued or replaced by new models.
8. **Buy One, Get One Free (BOGO) Offers**
– **Approach**: Encourage higher purchase volume with “Buy one, get one free” or “Buy one, get one 50% off” deals.
– **Example**: Apply BOGO offers on older inventory, helping reduce stock quickly without complex discount structures.
– **Result**: Simplifies the discount structure and appeals to customers looking for more value, effectively moving inventory.
9. **Targeted Email Marketing Campaigns**
– **Approach**: Use email marketing to promote special discounts on excess inventory to a targeted audience.
– **Example**: Send targeted emails with exclusive codes for discounted items, creating a sense of exclusivity.
– **Result**: Drives traffic to specific items, helping clear out excess stock with personalized promotions.
10. **Referral and Social Sharing Discounts**
– **Approach**: Encourage customers to refer friends or share promotions on social media in exchange for discounts.
– **Example**: Offer a “Share and Save” campaign, where sharing a product link on social media unlocks a discount code.
– **Result**: Increases brand exposure while moving excess inventory, attracting new customers through social channels.
4.How to set Pricing Online and Offline?
Yes!
1. **Operational Costs**
– **Online**: Lower overhead costs (e.g., no physical store rent), allowing brands to offer more competitive prices.
– **Offline**: Physical stores incur rent, utilities, and staffing costs, often resulting in slightly higher prices.
– **Result**: Online prices are typically lower due to reduced overhead, especially in highly competitive markets.
2. **Logistics and Shipping**
– **Online**: Shipping costs are often added at checkout, potentially impacting the final price the customer pays.
– **Offline**: Customers avoid shipping fees but may face additional travel expenses.
– **Result**: Total cost can be similar, but online prices may appear lower without factoring in shipping.
3. **Promotional Strategies**
– **Online**: Digital platforms often feature more frequent discounts, flash sales, and promotions tailored to online shoppers.
– **Offline**: Promotions are less frequent or occur seasonally, depending on the store’s foot traffic and sales strategy.
– **Result**: Online stores may offer more frequent discounts, creating an impression of lower prices.
4. **Price Transparency and Competition**
– **Online**: Customers can easily compare prices across different websites, leading to competitive online pricing.
– **Offline**: Price comparison is less convenient, allowing for slight price variations across stores.
– **Result**: Greater competition online generally results in lower prices to attract price-sensitive customers.
5. **Market Positioning and Perceived Value**
– **Online**: Some brands position themselves as budget-friendly online by offering exclusive online-only discounts.
– **Offline**: Physical stores may focus on experiential value, with customer service and product try-on, justifying slightly higher prices.
– **Result**: Online channels may adopt a value-focused approach, while offline stores focus on experience-based value.
6. **Sales Tax and Regional Pricing**
– **Online**: Taxes may vary by location, and some regions may offer tax-free purchases, affecting the final online price.
– **Offline**: Sales tax is generally applied based on the store’s location, making prices consistent across a region.
– **Result**: Regional tax differences may cause minor price variations between online and offline purchases.
7. **Product Exclusivity and Availability**
– **Online-Only Discounts**: Brands often offer exclusive online products or discounts to drive online traffic.
– **Offline-Only Offers**: Physical stores might feature unique in-store discounts or limited-time offers to attract foot traffic.
– **Result**: Online and offline stores may each offer exclusive discounts, depending on the sales strategy and customer traffic goals.
5.Can Pricing Be Increased by Offering Additional Services Like Extended Warranties and After-Sales Support?
1. **Enhanced Perceived Value**
– **Extended Warranty**: Offering a longer warranty period gives customers confidence in the product’s durability and quality.
– **After-Sales Support**: Providing ongoing support (e.g., troubleshooting or replacement services) builds customer trust and loyalty.
– **Result**: Customers perceive the product as higher quality and are more willing to pay a premium.
2. **Increased Customer Satisfaction and Loyalty**
– **Service Value**: Additional services such as product maintenance advice, repair options, and dedicated support lines improve overall customer experience.
– **Impact on Pricing**: Satisfied customers are often willing to pay extra for a product backed by superior service.
– **Result**: Enhanced service offerings can justify a price increase by ensuring customers feel well-supported and valued.
3. **Differentiation from Competitors**
– **Competitive Edge**: Services like extended warranties or exclusive support differentiate the brand in crowded markets, adding a unique selling point.
– **Premium Pricing Justification**: Customers are often willing to pay more for brands that offer valuable, practical services that competitors lack.
– **Result**: Standout service options allow the brand to charge higher prices and position itself as a more premium option.
4. **Reduced Price Sensitivity**
– **Customer Perspective**: Customers view added services as part of the product’s overall value, making them less sensitive to small price increases.
– **Pricing Flexibility**: Extended warranty and after-sales support reduce the emphasis on price alone, allowing brands to raise prices modestly.
– **Result**: A perceived service advantage reduces price sensitivity, supporting gradual pricing increases.
5. **Building Long-Term Relationships**
– **Customer Retention**: Offering services that extend beyond the purchase (e.g., support calls, replacement parts) strengthens customer relationships.
– **Upselling Opportunities**: After-sales support can open doors for upselling complementary products or services.
– **Result**: Longer customer relationships support higher lifetime value, making initial premium pricing more acceptable to the customer.
6. **Supporting Premium Brand Image**
– **Brand Perception**: Offering comprehensive support and warranty services aligns with premium brand positioning, appealing to quality-focused consumers.
– **Value Proposition**: A strong service package reinforces the brand’s commitment to quality, justifying higher pricing for a premium market segment.
– **Result**: Value-added services support a premium brand image, enabling a higher price point in line with customer expectations.